In addition to chips, hyperscalers need access to cheap water, power, and land.
Companies are used to having all the leverage. Refuse tax abatements and direct public funding and we will take our jobs elsewhere. (Never mind that study after study has shown that sports stadiums are a net loss to communities.)
Amazon’s HQ2 “search” was an extreme example of this. Having cities that had no shot spend time and effort putting together proposals they were never going to win. The winning cities were preordained. So much so that even when NYC didn’t provide subsidies they expanded operations anyway. The Arlington, Va. subsidy is specifically designed so that Amazon doesn’t get breaks unless they deliver real economic value.
This is a rare time when cities have leverage. If they don’t “win” the deal, there’s no meaningful loss to them. AI will just sit somewhere else and they get to use it.
If I’m a city, I create an RFP to make up for the negative externalities. Template below.
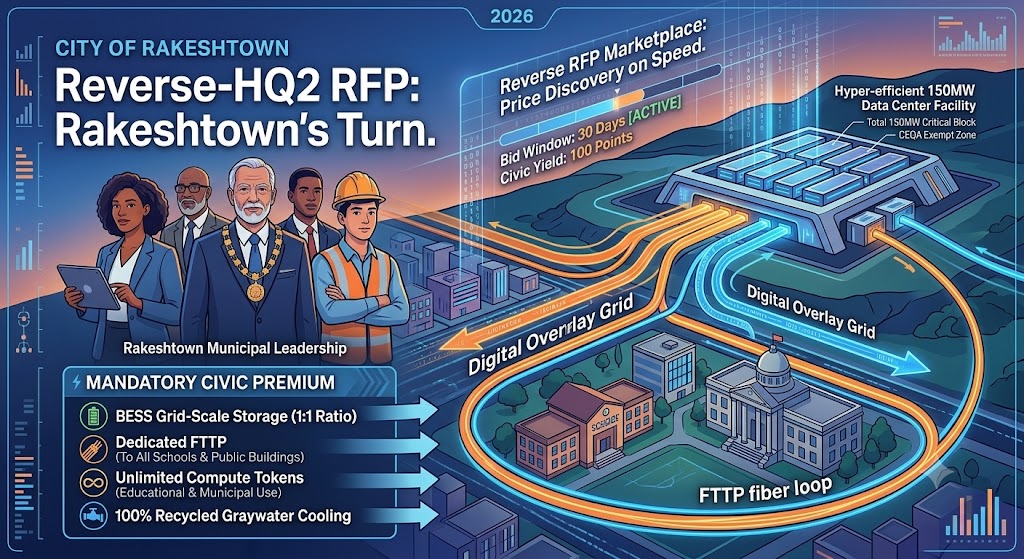
CITY OF RAKESHTOWN
Official Request for Proposals (RFP)
Release Date: June 2, 2026
Subject: Allocation of a 150MW Critical Infrastructure & Resource Block
1. Executive Summary & Objective
The City of Rakeshtown is pioneering a Reverse-HQ2 procurement model for the digital age. Recognizing that hyperscale AI and cloud computing face a severe global bottleneck in power, water, and shovel-ready land, Rakeshtown is auctioning its scarce municipal assets to the highest civic bidder.
Traditional data center RFPs focus on job creation promises and demand tax abatements. Rakeshtown acknowledges that post-construction operational job growth is minimal. Therefore, this RFP weaponizes our speed-to-market advantage to extract massive, upfront structural wealth and direct compensation for localized negative externalities. If you want access to our grid and resources, you must pay for the privilege.
2. The Resource Block (What We Provide)
Rakeshtown offers a single, fully permitted, shovel-ready parcel featuring:
- Power: 150MW of prioritized grid connection with guaranteed transmission pathing.
- Fiber: Dual-path, diverse-routed sub-millisecond dark fiber backhaul to major regional exchange points.
- Zoning: Pre-approved industrial zoning bypassing standard CEQA/local environmental review delays via a pre-negotiated municipal overlay.
3. Mandatory Civic Concessions (The Bidder’s Premium)
Bidders will not receive tax credits. Instead, proposals will be evaluated strictly on the scale, speed, and capitalization of the following mandatory offsets for local externalities:
A. Grid Stability & Power Mitigation
- Co-Located Battery Storage: Bidders must finance and construct a minimum 1:1 ratio grid-scale battery storage system (e.g., BESS infrastructure) capable of discharging back into the Rakeshtown municipal grid during peak demand events.
- Peaker Plant Retirement Fund: An ongoing per-megawatt-hour tariff paid directly to the city to finance local residential rooftop solar and municipal green-energy independence.
B. Water & Environmental Capital
- Wastewater Infrastructure Upgrades: Absolute prohibition on raw municipal freshwater consumption for evaporative cooling. Bidders must fund a complete upgrade to the Rakeshtown water recycling plant, utilizing 100% industrial graywater.
- Acoustic Shrouding & Micro-Forest Buffers: Full engineering plans for active acoustic cancellation and a mandatory 500-foot dense micro-forest perimeter to completely absorb the low-frequency hum of industrial HVAC chillers.
C. The Local Compute & Connectivity Dividend
- Fiber to the Premises (FTTP) Municipal Drop: Bidders are required to pull a dedicated, dark fiber-to-the-premises (FTTP) glass loop directly from their network trunk to all public municipal buildings, emergency services hubs, and Rakeshtown public schools.
- Unlimited Compute/AI Tokens: Bidders must provide a sovereign, unmetered, API-accessible slice of their hosted foundation models. This guarantees unlimited tokens for all Rakeshtown public schools and public buildings in perpetuity—fully subsidizing the city’s operational and educational software layer.
4. Commercial Framework & Non-Negotiable Terms
To maximize velocity, Rakeshtown maintains a zero-negotiation stance on its legal and commercial terms.
- PILOT Program: Traditional property taxes are replaced by a mandatory Payment in Lieu of Taxes (PILOT) framework, establishing an escalating floor price per megawatt utilized.
- The “Take It or Leave It” Contract: The legal indemnity, liability, and resource-delivery contract attached to this RFP is final. Redlines or requests for legal modifications will result in immediate disqualification. If you lack the organizational velocity to sign our standard terms, you cannot compete for this block.
5. Evaluation Matrix
Proposals will be scored using a 100-point rubric focused exclusively on civic yield:
| Evaluation Criteria | Weight | Description |
| Civic Infrastructure Funding | 40 Points | Total dollar value of upfront infrastructure upgrades (Water, Power, Roads) and FTTP physical buildout. |
| Grid Resilience (BESS) | 30 Points | Total capacity and discharge efficiency of the funded battery storage footprint. |
| Compute & Token Dividend | 20 Points | Verification of API delivery pipelines for unlimited public sector and educational token allocations. |
| Execution Velocity | 10 Points | Guaranteed timeline to break ground, proving the bidder’s need for speed. |
Submission Window: Bids close precisely 30 days from issuance. Late submissions or requests for extensions will be ignored. Rakeshtown has the bottleneck; the clock is yours.